The Future of Transporation in Kiel
Kiel, located in the Northern German Bundesland of Schleswig-Holstein, is a moderately sized city with about 250,000 residents. The region itself promotes the use of renewable energy production by being one of Germany's top wind energy producers. But on top of these energy production goals, the cities themselves, including Kiel, also plan to reduce their overall CO2 emissions by overhauling their mobility systems.
In the future, the city hopes to contribute to this goal by reducing the amount of automobile use within the city and increasing the usage of public transit. Specifically, this will be done by adding high volume Tram or Bus Rapid Transit lines to the current system. If all goes well, residents will have better and better options for getting around without a car in the coming years.


Unfortunately, the building out of this system alone may not be enough to reduce automobile usage to acceptable levels to achieve climate goals. On top of providing incentives to switch from cars to alternatives, enforcing disincentives for driving may also be a necessary ingredient to the process. One example of this is a congestion-charge zone. These zones provide disincentives to drivers by charging a fee to either enter and exit. So far only only handful of cities have implemented these zones including Singapore, London and Stockholm among others. Furthermore, these zones have proved to successfully reduce traffic and direct citizens to other forms of transportation.
If these charge zones do indeed work, then how could we best plan for one inside a city? The method I introduce here for determining these areas relies on a measure of something called walkability. Walkability describes the ease of which pedestrians can navigate the city. When areas are highly walkable, nearby amenities such as grocery stores, pharmacies and schools are reachable by foot. The more walkable an area, the less dependent these residents are on cars for carrying out day-to-day tasks. It also stands to reason that these areas would be least resistant to a planned congestion-charge zone.
Below, I want to do the following:
- Introduce my walkability measure of Kiel
- Propose a congestion-charge zone for the city
We will go over the walkability measure in detail as well as showing a couple of existing congestion-charge zones before I introduce my very own for Kiel.
Keep scrolling to read further!
The map remains in place as you scroll 😉
Walkability in Kiel
Walkability in Kiel is shown here, with all colored areas also representing places where people live. A legend for these colors and values is shown below:
Walkable
Un-walkable
The time you see in the scale above is the average walking time to all nearby amenities from a single residence. To make this average I used eight separate categories of amenities:
These eight categories comprise the majority of trips people make everyday within their cities. One notable absence though are work trips. Unfortunately, this would have been impossible to calculate with the available data; therefore, I did not include it.
Map tip: To see even more detailed information about individual residences, keep zooming in using the controls in the bottom-right hand corner until the walkability surface disappears. Clickable points will appear instead.
How could we use this data?
Having this view of the city could help with the planning of congestion-charge zones which are inconvenient for the fewest amount of people possible. When we set a threshold value for walkability average, say 15 minutes, we could find all areas in the city which meet this criteria and begin to draw what our congestion-charge zone would look like.
Naturally, it would be very unfair to increase prices for driving in areas where people are highly dependent on their cars. That is why we use an average measure of walkability to find areas where drivers will be least affected. This measurement could also just be a single factor contained within a multi-factor analysis to determine the optimal area.
Before I introduce my own proposal for a congestion-charge zone in Kiel, we will take a look at several other congestion-charge zones in Europe.
Congestion-Charge Zone
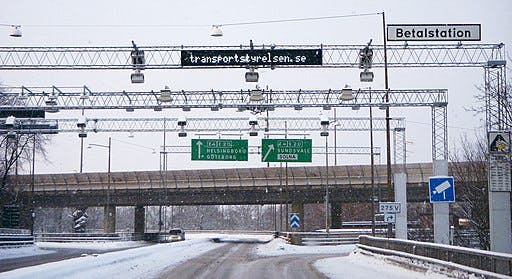
Stockholm
Stockholm, Sweden has had its congestion-charge zone in place since 2006, after passing by a voter referendum. In the years immediately following its implementation, the city saw a 20% drop in traffic and was able to use the funds collected for road and other transportation infrastructure improvements.
The system functions with a series of entry and exit points around the congestion-charge zone. Each time a driver passes into or out of the zone they are charged a fee that can vary by time of day (rush hour typically being a more expensive time to drive). Fees are charged using a series of control points which are able to scan license plates and bill registered drivers.
The project has been widely considered a success and enjoys public support. This same type of congestion-charge zone was also replicated in Gothenburg.

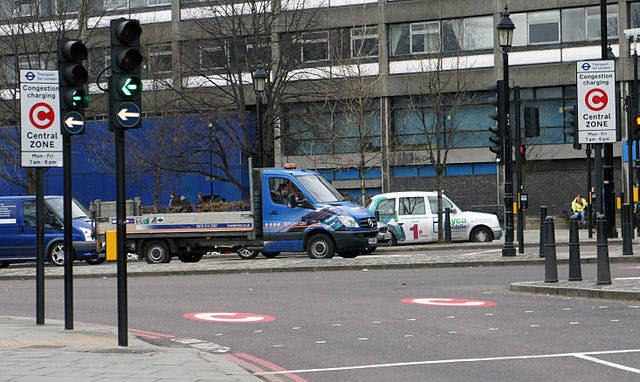
London
London's congestion-charge zone has existed since February 2003 and is located in the center of the city. Since its introduction, it has been able to reduce traffic in the city center and was successful in diverting a considerable amount of people to public transportation.
Potential for Kiel
Here is a what a congestion-charge zone could potentially look like in Kiel. Inside of the area shown on the map, average walking times to all nearby destinations fall under 15 minutes. The points on the map show where potential charge zone entry controls could be placed.
Such a measure would understandably be very controversial for Kiel and spark many debates. When imagining such charge zone systems, it is best to start with an earnest, logical approach such as this for proposing first drafts. Afterwards, these plans need a public debate to emerge in order to start a cooperative planning process. This back-and-forth between planners and city residents will help the measure truly achieve its goal of contributing to a more sustainable transportation system rather than being an annoyance or a burden to locals.
Conclusion
With this case study, I hoped to show how urban analytics, in the form of a walkability index, can be an effective tool for imagining and proposing new futures in cities. I also hoped to introduce many to the idea of congestion-charge zones and why they may be a practical auto-reduction measure for many cities around the world.
To make this sort of walkability analysis more widely available, I will continue work on an open-source tool set that will enable others to collect the same type of data for their cities. To learn more or perhaps begin using it yourself, please follow the project on Github.
For any questions about this analysis or anything contained within this website, please get in touch!